Étienne Simon

Reasoning on representations learnt by neural networks

Visualisation

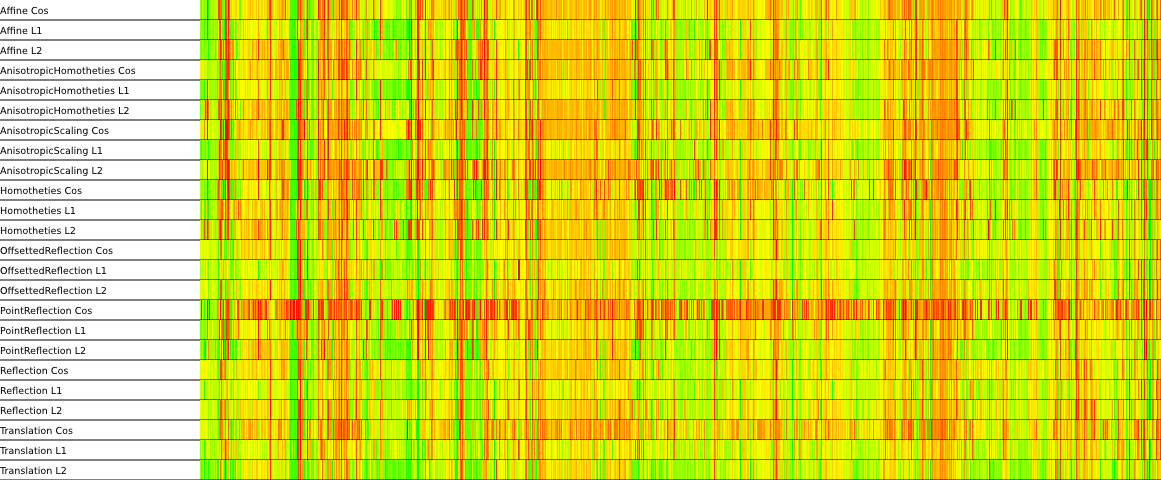
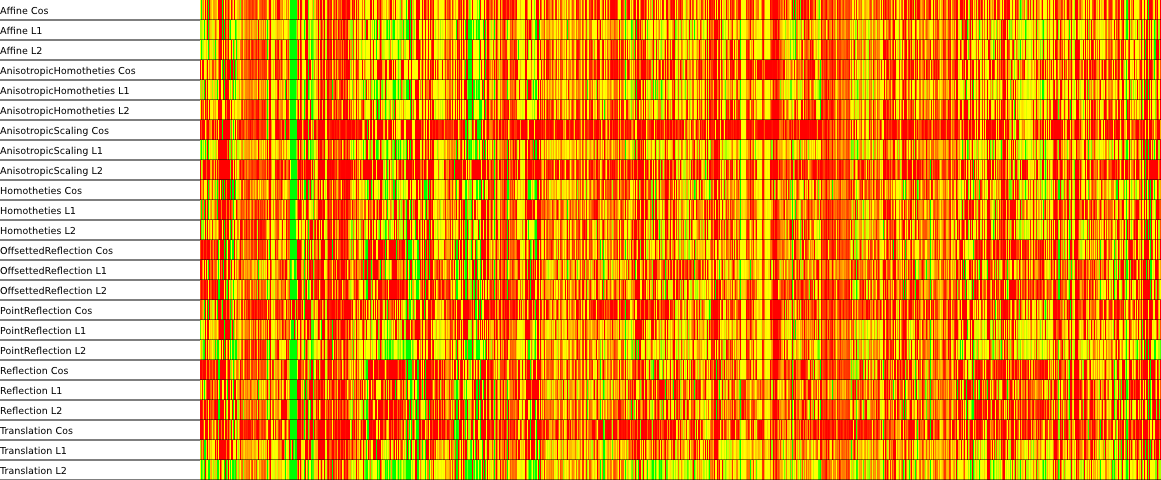
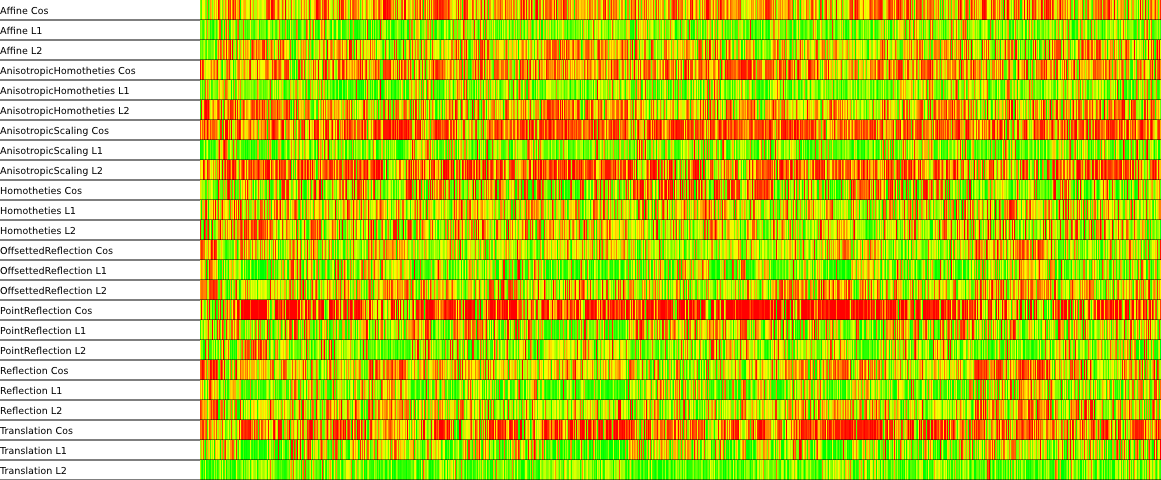
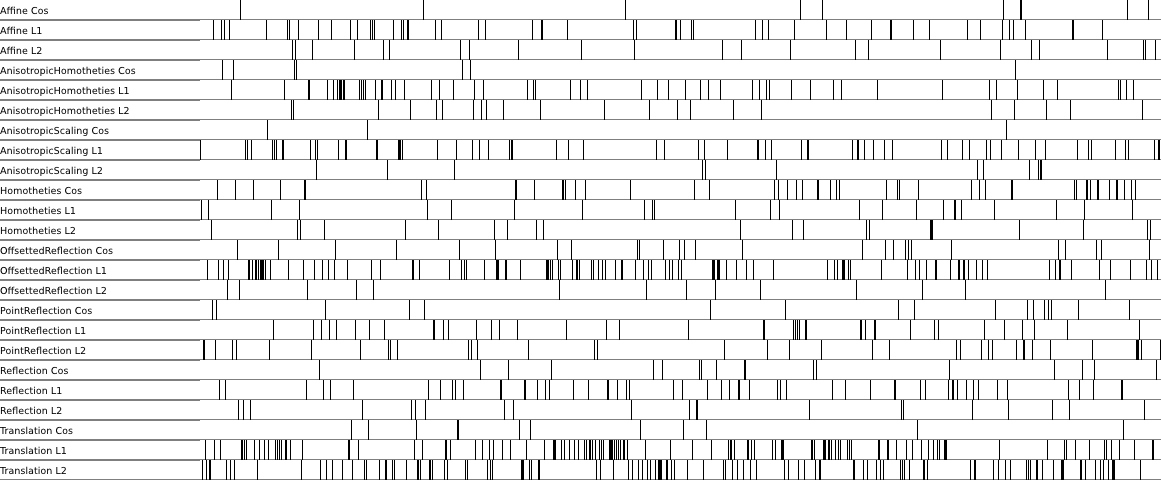
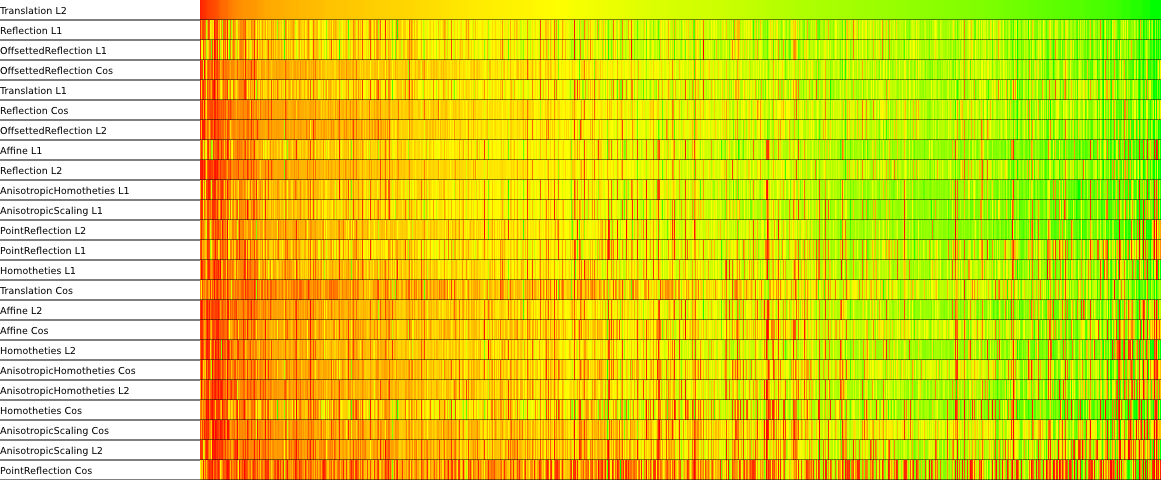
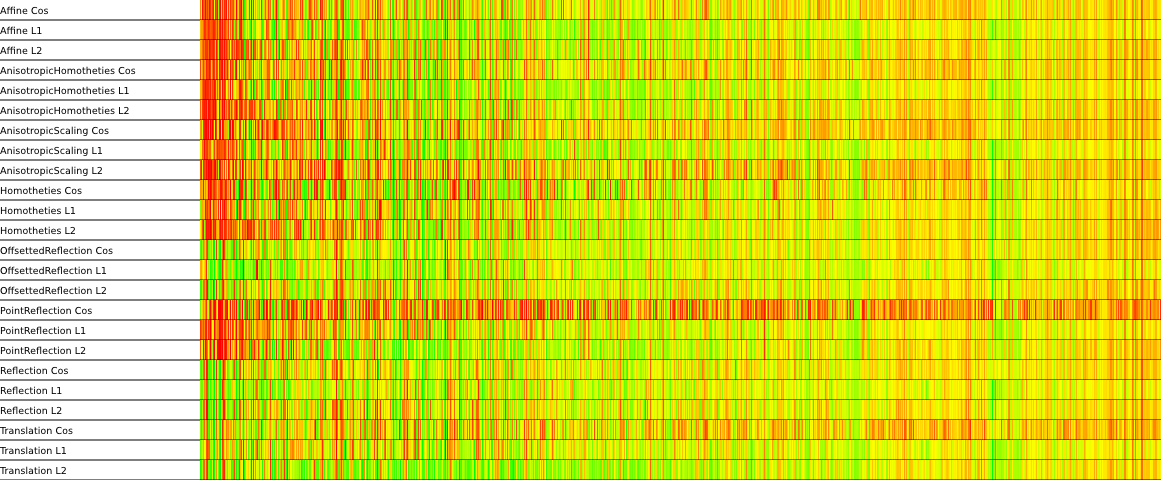
The first four figures have the same format: the row indicates the transformation (models), the column indicates the relation (since there are 961 relations in the test set, the columns are 1 pixel large).
FB15k mean rank matrix (transformation×relation)
Figure 1: For each transformation (rows), the mean rank is given for each relation (columns). A logarithmic scale is used: green means rank 1, red rank 14951, yellow rank 122.27 (14951). Link to SVG version.
FB15k top10 matrix (transformation×relation)
Figure 2: For each transformation (rows), the top10 is given for each relation (columns). A linear scale is used: green means all triplets were in the top10, red none of them, yellow half of them. Link to SVG version.
FB15k mean rank rank matrix (transformation×relation)
Figure 3: For each relation (columns), a colored bar is given to the transformation (rows) depending on its mean rank. The transformation with the best mean rank is given a green bar, the transformation with the worse mean rank a red bar. Link to SVG version.
FB15k top1 matrix (transformation×relation)
Figure 4: For each relation (columns), a black bar is given to the transformation (rows) with the best mean rank. Link to SVG version.
FB15k rank distribution example
Figure 5: Cumulative distribution of ranks for two transformations: translations in red and affine in green (both using the L1 norm for similarity). The abscissa of each point is its rank, the ordinate the number of relations with a smaller mean rank. The scale is logarithmic in both dimension.
FB15k mean rank matrix (transformation×relation) sorted by best result
Figure 6: For each transformation (rows), the mean rank is given for each relation (columns). A logarithmic scale is used: green means rank 1, red rank 14951, yellow rank 122.27 (14951). Furthermore the transformations are sorted by macro mean and the relations are sorted by mean with the best transformation (Translation L2). Link to SVG version.
FB15k mean rank matrix (transformation×relation) sorted by size of training set
Figure 7: For each transformation (rows), the mean rank is given for each relation (columns). A logarithmic scale is used: green means rank 1, red rank 14951, yellow rank 122.27 (14951). Furthermore the relations are sorted by number of training examples. Link to SVG version.